


One of the most common methods in finance, investment research, and event studies, the Cumulative Abnormal Return calculation is widely used. It assists investors, analysts and researchers in making a decision on how a company’s stock did after a given event, whether better or worse. CAR doesn’t just reflect the movement in the stock price; it reflects that which is above-normal market performance.
When a business releases earnings for its fourth quarter, a merger, launch of a new product, or a change in leadership, the stock price tends to respond. But the overall market trend, economic reports, interest rates, and investor confidence also play a role in stock valuations. Therefore, a 4% increase in a company’s stock price on a 3% gain in the overall market would not be considered as responsible as the company alone for the 4% increase. Cumulative abnormal return calculation is a method that subtracts out the return that is expected based on the market, leaving only the returns that are not expected.
This property has made CAR a common gauge used in the academic finance, corporate valuation, investment management, and financial research communities. It is used by analysts to analyse mergers and acquisitions, earnings announcements, dividend changes, regulatory decisions, lawsuits and a myriad of other corporate events. Investors also use CAR to gauge if a company’s news was really adding value to their shareholders or if it was just a case of the stock rising with the rest of the market.
The cumulative abnormal return (CAR) is a more objective measure of the market reaction since it considers the actual return relative to the expected return from models involving the capital asset pricing model (CAPM), market model, and market-adjusted model. This makes CAR a crucial indicator for anyone interested in market efficiency or how new information impacts security prices.
What Is Cumulative Abnormal Return (CAR)?
Cumulative Abnormal Return (CAR) is the sum of the abnormal returns that a stock or a portfolio generates during a certain event period. It is determined by summing all of the abnormal returns over a set time period, which enables researchers to determine the effect of a specific event on the overall price of a stock.
Before understanding CAR, it is important to understand abnormal return. An abnormal return is the difference between an investment’s return and what was expected. Expected return is the return that one would normally be able to expect given the market and the riskiness of the stock. The actual return is a difference from this expectation and is referred to as the abnormal return.
Say, for instance, that investors are forecasting a 2% gain in a company’s stock following normal market activity, but the share price goes up by 6% when the company reports earnings. The extra 4% is the abnormal return as it falls above the expected return.
CAR just adds together these abnormal returns across a number of trading days. It is usually averaged over a short time period, as longer time periods could include unrelated market fluctuations and the results would be less reliable.
Formula:
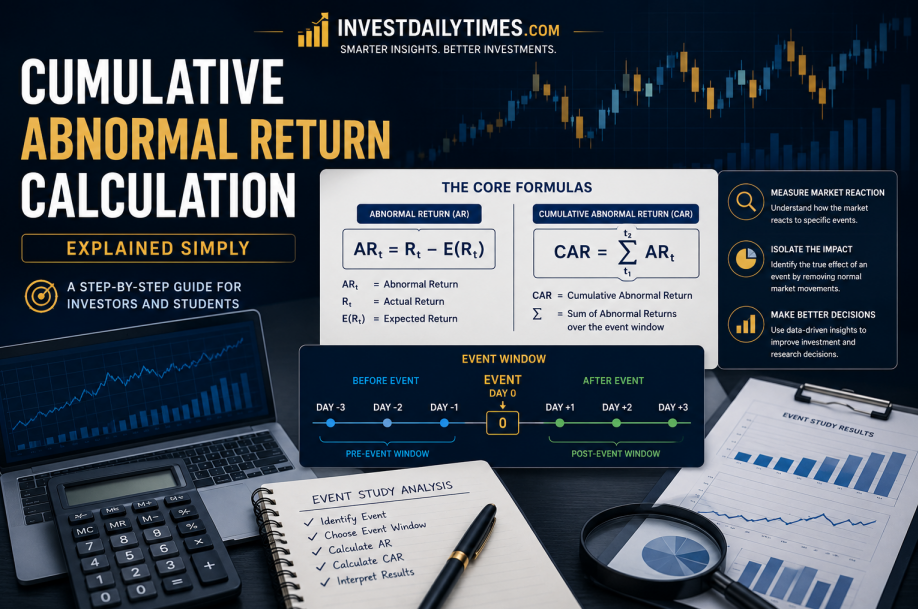
The cumulative abnormal return (CAR) is calculated by summing all abnormal returns over the selected event window.
This implies that the cumulative abnormal return (CAR) is simply the sum of the abnormal returns in the selected event window.
A positive CAR indicates that the stock did better than investors’ expectations during the event period, suggesting that investors bought the stock during the event period. A negative CAR means that the stock has been less than expected, which reflects a less positive market response. A CAR near zero typically indicates that the event did not cause significantly more than normal market movements.
Since CAR is about return surprises and not about returns, it gives a better sense of investors’ reaction to key corporate announcements or market events.
Why Is Cumulative Abnormal Return Calculation Important?
The calculation of cumulative abnormal return is important in modern finance as it helps distinguish the change in the stock price from the expected normal movement in the stock price. If this weren’t corrected, investors could mistakenly believe that the gains or losses were due to company news when they were actually due to the market.
The major benefits of CAR are that it is based on risk-adjusted event performance rather than just price appreciation. Macroeconomics, industry trends, monetary policy, inflation, geopolitical news and investor sentiment all have an impact on financial markets. By comparing what is actually happening with what is expected to happen, CAR helps to remove a good portion of this “noise.”
Cumulative abnormal return calculation is often employed in event studies, which aim to assess if the announcement of a merger or acquisition, an earnings release, a dividend announcement, the appointment of a CEO, a product launch, a legal judgment, or a regulatory approval had a statistically significant effect on shareholder value.
Investment professionals also use CAR to assess if a fund manager, corporate executive or strategic decision has added value in excess of what the market had anticipated. CAR has emerged as one of the most popular approaches to research on market efficiency and investor behaviour in academia.
CAR can provide businesses, investors, and analysts with valuable insights into how investors react to key corporate decisions and broader Stock Market movements. The positive CAR could be a sign of growing investor confidence, whereas the negative CAR could reflect a lack of investor confidence or potential worries about future returns. While CAR does not forecast future stock prices, it is a good indicator of the behaviour of markets to new information within a specific time frame.
In finance, economics, and investment research, one of the most trusted computational methods is to calculate cumulative abnormal returns, which enables the isolation of the performance of the event. In the context of portfolio management, CAR can also be used to assess whether an investment manager achieved returns higher than the market average, as opposed to just investment returns.
How Does Cumulative Abnormal Return Calculation Work?
To compute cumulative abnormal return, we first calculate the abnormal return for each day of the event period, and then sum all the abnormal returns. The idea is to see if a certain event made the stock act differently than investors would normally expect given normal market conditions.
The first step is to identify an event, like a product launch, regulatory decision, merger, or an earnings announcement. The date will be the one that is used as the centre point for analysis, which is typically called Day 0. Researchers then select an event window; this can range from a few days before to a few days after the event to reflect both pre- and post-event market reactions.
Then the actual return of the stock is computed for each trading day in the event window. Meanwhile, an expected return is calculated based on a financial model, such as the Capital Asset Pricing Model (CAPM), the Market Model or the Market-Adjusted Model. The expected return is the average return the stock would have had if the event were not to happen.
The abnormal return is a difference between the actual and expected return.
The abnormal return (or excess return) equals the actual return minus the expected return.
After computing the abnormal return for each trading day in the event window, the returns are summed to find the cumulative abnormal return.
For instance, if the firm has better-than-anticipated results and its stock has continually performed better than anticipated over the past several trading days, the abnormal returns for each day can be summed to yield a positive CAR. On the other hand, if investors are disappointed in the stock’s performance relative to what they expected for the same investment, then the CAR will be negative.
Cumulative abnormal return calculation allows us to understand how investors reacted to a certain event by separating the stock’s returns from the market return.
Cumulative Abnormal Return Calculation Formula Explained
The formula for calculating cumulative abnormal return (CAR) is simple, but each term is important for measuring abnormal stock performance.
The first step is to compute the abnormal return on the stock for each trading day.
Actual Return – Expected Return = Abnormal Return (AR)
Where:
- Actual Return (Rₜ): Actual return of the stock for a particular trading day.
- Expected Return (E(Rₜ): The return that is expected by an investor with the same amount of risk as the stock in question and on the same level of market performance.
Once the abnormal return for each day is calculated, all the abnormal returns for the chosen event window are summed.
CAR = Σ ARₜ
Where:
- CAR = Cumulative Abnormal Return
- Σ = Sum of all abnormal returns Abnormal return on each trading day in the event window.
ARₜ= Abnormal return (ARₜ) for each trading day in the event window.
Each event day’s abnormal return in the event window:
If a company announces a merger, and the abnormal returns in a 3-day event window are:
| Trading Day | Abnormal Return |
| Day -1 | 1.2% |
| Day 0 | 2.5% |
| Day +1 | 0.8% |
The cumulative abnormal return would be:
CAR = 1.2% + 2.5% + 0.8% = 4.5%
If the CAR is positive, the stock outperformed expectations over the event period, and if the CAR is negative, the stock underperformed relative to expectations over the event period.
While the mathematical formula is a relatively easy one, the reliability of CAR is crucial to the accuracy of the expected return and the choice of event window. Financial researchers typically rely on existing asset pricing models and market data to get a more accurate picture of the market and to analyse the factors affecting asset prices.
How to Calculate Cumulative Abnormal Return Step by Step
Cumulative abnormal return calculation is a systematic process that can help in separating out the effect of a specific event on the company’s stock price from the effects of other events. The analysis will be accurate and consistent when the following steps are followed.
Step 1: Identify the Event Date
Select the event you wish to analyse, either an earnings release, merger or announcement, or dividend declaration or CEO appointment. This date is used as Day 0 for analysis.
Select an Event window from step 2 above. From
Step 2 above, choose an Event window.
Determine the period over which you’ll evaluate the stock’s performance. Common event windows include (-1, +1), (-3, +3), and (-5, +5) trading days. The event window should be sufficiently wide to allow the market to respond, but not so large as to inflict unnecessary volatility on the market.
Step 3: Compute Actual Returns
Compute the daily return for each day in the trading period during the event window using historical stock prices.
Step 4: Estimate Expected Returns
Assume that the event had not happened and calculate the returns of the stock. Usually this is done through the CAPM, Market Model or Market-Adjusted Model.
Step 5: Calculate Abnormal Returns
Calculate the difference between the actual return and the expected return over each trading day. Abnormal Return = Actual Return – Expected Return. For each day in the event window, repeat the above calculation.
Step 6: Add the Abnormal Returns
Finally, add up all of the abnormal returns over the chosen event window.
CAR = Σ Abnormal Returns
The value obtained is the total abnormal performance of the stock over the event period.
To establish if the observed CAR is significant or just a natural fluctuation in the market, researchers will generally perform additional statistical tests. This further analysis bolsters the validity of the results of the event study.
Real Example of Cumulative Abnormal Return Calculation
It is easier to comprehend with an example.
Suppose the publicly traded company reports more favourable quarterly results than anticipated. An investor wishes to analyse the market in a three-day event window, that is: the day before the announcement, the day of the announcement, and the next day of trading.
The expected returns have already been calculated based on a financial model, and the daily abnormal returns are displayed.
| Event Day | Actual Return | Expected Return | Abnormal Return |
| Day -1 | 2.0% | 1.0% | 1.0% |
| Day 0 | 5.0% | 2.0% | 3.0% |
| Day +1 | 1.5% | 0.5% | 1.0% |
To compute the cumulative abnormal return:
CAR = 1.0% + 3.0% + 1.0% = 5.0%
The positive CAR (5.0%) indicates that the stock of the company generated returns that were greater than what was expected given the time period of the event. This indicates that investors were pleased with the earnings release and responded with more positive than anticipated stock performance.
In the case of abnormal returns that had added up to be negative, the result would have been the opposite—the market would have reacted less positively than anticipated.
For simplicity, this example considers the three trading days, but in a professional event study, larger numbers of trading days and longer estimation periods may be used before the expected return is calculated. However, the concept is the same: compare actual performance with expected performance, work out abnormal returns and sum them up to gauge the total impact of the event.
How CAPM Is Used in Cumulative Abnormal Return Calculation
Cumulative abnormal return (CAR) can be calculated using the Capital Asset Pricing Model (CAPM), which is one of the most popular approaches. Instead of assuming that a stock will merely follow the market, CAPM takes into consideration the relationship between the stock’s riskiness and the performance of the market. This makes it a favourite in academic research, financial analysis and professional event study fields.
The underlying principle of CAPM is that the investor should receive a return that would cover what he or she lost from the time value of money and the amount of market risk which he or she faces. The model employs three important factors to calculate a stock’s expected return:
Expected Return = Risk-Free Rate + Beta × (Market Return − Risk-Free Rate)
The formulas are as follows:
Where:
- Risk-Free Rate (Rf): A rate of return from an investment that is essentially risk-free, typically the rate of return on short-term government securities.
- Beta (β): A measure of how sensitive a stock is to movements in the overall market. Beta higher than 1 means that the stock is more volatile than the market, and a lower beta indicates that the stock is less volatile.
- Risk-free rate (Rf): The rate of return of a riskless asset.
If the risk-free rate is 2%, the market is projected to have a 10% return, and the beta of a company is 1.2, for instance, then Using CAPM:
Expected Return = 2% + 1.2 × (10% − 2%) = 11.6%
The abnormal return on the stock is:
15% − 11.6% = 3.4%
The abnormal return is measured against the CAPM’s expected return. The CAR is obtained by adding up all the daily abnormal returns comprising the event window.
The real power of CAPM is that it takes into account market risk instead of historical averages. There are other models, like the Market Model, Market-Adjusted Model, and Fama-French Multi-Factor Model, that are also employed in the field of finance, but CAPM is one of the more widely recognised and commonly used models for CAR analysis.
Understanding Event Windows in CAR Analysis
A time period before and after a significant corporate or market event is called an event window. The choice of an event window is one of the most crucial choices for the cumulative abnormal return calculation since it will influence the trading days which are included in the analysis.
The day of the event is considered Day 0, and the days of trade before and after the event are considered negative and positive numbers. There are various event windows that researchers utilise based on how fast they believe that the market will react to the event.
The most frequently used windows are:
- (-1, +1): The day prior to the event and the day following the event.
- (-3, +3): Three days prior and subsequent to the event.
- (-5, +5): 5 trading days prior to and after the event.
- (-10, +10): A wider range of time to learn about slower market reactions.
Shorter event windows are more suitable for information that is likely to be factored into stock prices right away, such as earnings releases or central bank announcements. For events such as mergers, regulatory approval, or significant strategic shifts, a longer event window might be more appropriate as investors may need more time to digest the new information.
The pre-event period is used to gather potential information leakage or insider trading information prior to the formal announcement. Day 0 is the day of the event/announcement made public. The post-event period is where researchers can see the delayed market reactions, investor adjustments or price corrections after news has been released.
A window that is too long will create unrelated market events that can skew the numbers, while a window that is too short will be unable to capture the entire market reaction. Hence, it is crucial to choose the proper event window for the purposes of obtaining reliable and meaningful estimates of cumulative abnormal returns (CAR).
How to Interpret Positive and Negative CAR Results
After determining the cumulative abnormal return, the next step is to interpret it. CAR is used to determine the actual performance of a stock relative to its performance during the same event period in excess of the performance during a normal period of the market.
A positive CAR means that the stock has returned more than expected. This is usually a positive sign of investors’ reaction to the event. Positive CARs are typically seen following strong earnings releases, product launches or acquisitions that create value for the company or regulatory approvals.
If the stock of a company rose by 6% during the event window, but was only anticipated to rise by 2%, then positive abnormal returns would lead to a positive CAR. This means that the investor was more positive than the traditional financial models had forecasted.
If the return on the stock is negative, it is called a negative CAR. When investors are negatively affected by disappointing earnings, failed acquisitions, unexpected legal issues, dividend cuts, or negative regulatory decisions, negative CAR values may be a consequence.
A CAR with a value in the vicinity of zero normally means that the event had a negligible impact that was measurable after the market had priced it in. This can happen if the investors were already expecting the announcement or if the information disclosed did not offer any new information about the company’s future prospects.
It is important to keep in mind that CAR is a measure of past market behaviour, not future investment returns. A positive CAR does not mean that future gains will be assured, and a negative CAR does not necessarily mean that the stock is destined for failure. Financial statements, valuation metrics and other economic analysis are frequently used in tandem with CAR before making investment decisions.
Common Mistakes in Cumulative Abnormal Return Calculation
While the cumulative abnormal return formula is simple to use, there are some common errors that can cause the analysis to be less accurate. Knowledge of these issues aids in generating more reliable event study results for researchers and investors.
One of the most frequent errors is selecting an inappropriate event window. The time between the event and the reaction to the market could be too brief to capture substantial market adjustments. If it is too long, a number of other news and general market events could impact the stock prices, making it hard to assess the impact of the actual event.
The other common error is selecting an incorrect expected return model. The different models provide different estimates of the expected returns, and selection of inappropriate models can result in abnormal returns. Each of the CAPM, Market Model and the Market-Adjusted Model has its own set of pros and cons that are dependent on the research question and available data.
Some analysts make the mistake of comparing the raw stock prices rather than returns. CAR is not based on absolute price changes and therefore, prices can be misleading in reaching a conclusion.
Another problem is withholding the stock splits, dividends, and other corporate actions. Where there are such events, historical prices should be adjusted to account for these events, in order to calculate returns that reflect the performance of the shareholders.
It is also important that researchers don’t use calendar days instead of trading days in their definition of event windows. Financial markets are not open on weekends or holidays, and event studies should always be conducted on a specific trading day or day of the week.
Last but by no means least, conclusions can be weakened by not conducting statistical significance testing. It is not enough to have either a positive or negative CAR to conclude that an event caused the stock movement. The statistical analysis is used to see if the abnormal returns are significant and are more likely due to the event in question as opposed to normal market fluctuations.
Real-World Applications of Cumulative Abnormal Return
Cumulative abnormal return (CAR) is one of the most useful tools for financial analysis, as it allows for the measurement of the investor response to major events in the corporate and market environment. CAR does not merely measure the fluctuation in the price of a stock; it measures whether the fluctuation was larger or smaller than what is typically seen in the market at that time. Consequently, it is a common practice in the academic world, investment management, corporate finance, and market analysis.
An often-used application of CAR is the study of earnings announcements. Public companies provide financial reports in the quarterly and annual periods, and investors watch if the earnings are in excess, at par or below the expectations of the market. Analysts can use cumulative abnormal returns around the time of the announcement to see if the announcement was met with positive or negative pricing that was not driven by the market.
CAR is also widely used to evaluate mergers and acquisitions (M&A). As soon as one company informs another company that it has decided to buy them, investors quickly check if the acquisition will be value-creating for the shareholders. Positive CAR suggests investors’ confidence in the acquisition, and negative CAR suggests investors’ concerns regarding the purchase price, financing or integration risk.
Another significant application is determining the market response to CEO promotions or executive changes. When a knowledgeable management-level executive joins a company, or when a company experiences a sudden resignation of a long-time executive, investors tend to react negatively to the change. CAR is a tool for researchers to measure the impact of these leadership shifts on investor confidence.
Financial analysts also use Cumulative Abnormal Return in the analysis of product releases, dividend announcements, stock splits, lawsuits and legal decisions, regulatory approvals and changes in government policies that have a significant impact on investor sentiment. For instance, pharmaceutical firms can see abnormal returns when they are approved to produce a new drug, and technology firms can see abnormal CAR when a big product announcement is made.
In addition to corporate events, CAR is very important in academic event studies. It is utilised for studying the impact of economic policies, environmental regulations, corporate governance reforms, sustainability efforts, and macroeconomic announcements on markets. CAR can offer insightful information into investor behaviour and market efficiency since it strips out any expected returns from market performance.
Cumulative abnormal return is also employed by investment professionals to assess trading strategies, to compare portfolio performance and to test financial theories. CAR is a key analytical tool for anyone learning about capital markets because it can identify stock performance in relation to events.
FAQs
What is cumulative abnormal return (CAR)?
The cumulative abnormal return (CAR) of a stock refers to the sum of all of the stock’s abnormal returns within a chosen event window. It reflects the performance of the stock after a particular event compared to what the stock’s return should have been.
What is the formula to calculate cumulative abnormal return?
The abnormal return for each trading day is first computed, and then the abnormal returns are cumulated over the specified event window to obtain CAR.
CAR = Σ (Actual Return – Expected Return)
What is the difference between abnormal return and cumulative abnormal return?
An abnormal return represents the unexpected return on a single trading day, while cumulative abnormal return is the sum of abnormal returns over several trading days, which represents the overall market reaction to an event.
Does cumulative abnormal return have a negative value?
Yes. If the CAR is negative, it means that the stock’s actual returns were below the expected returns over the event period. This frequently is a sign of a poor market response to new information.
What does a positive CAR mean?
When the CAR is positive, it means the stock performed better than expected during the event window, indicating a favorable investor reaction to the event. A positive CAR suggests that the company’s stock outperformed normal market expectations, reflecting increased investor confidence and positive market sentiment.
Is it possible to compute cumulative abnormal return using Excel?
Yes. Formulas can be used in Excel to calculate daily returns, expected returns, abnormal returns and cumulative abnormal return. For larger event studies, however, the software will typically be statistical packages like R or Python, as well as specialised financial databases like Stata or other programs.
Does CAR restrict itself to academic studies?
No. Although CAR is frequently used in the academic world to examine the price response of stocks to major events, investment companies, financial analysts, portfolio managers, corporate finance practitioners, and market researchers also employ it to assess the influence of major events on stock prices.
Is having a positive CAR always an indicator of future stock appreciation?
No. CAR measures the market’s response to the event in question over a given period of time. It cannot be relied upon to predict stock movements or ensure investment success in the future. When evaluating an investment, investors should take a look at CAR in the context of financial analysis, company fundamentals, valuation analysis, and market analysis.
What’s the difference between an estimation window and an event window?
An estimation window refers to the time period in the past that is used for estimating a stock’s normal or expected return. An event window is the time around the event in which abnormal returns are calculated and summed up to get cumulative abnormal return (CAR).
Conclusion
One of the most useful ways of measuring the reaction of financial markets to significant events is the calculation of cumulative abnormal returns. CAR allows investors to see the overall stock response to new information by taking the difference between the stock’s actual return and its expected return and adding together the abnormal returns over a specific period around the event.
CAR corrects for normal market movements and is a better measure of event-driven performance than simple stock returns. This is the reason why it is gaining popularity in finance research, corporate valuation, investment analysis, and academic event studies. Cumulative abnormal return can be used to assess earnings announcements, M&A, product launches, executive changes, or regulatory actions and results to determine the real effect on shareholder value.
While the calculation is relatively simple, the results of a CAR depend on the window of events, an appropriate expected return model, high-quality market data, and proper statistical analysis. These factors help ensure that abnormal returns observed are related to the event being studied, and not to unrelated market fluctuations.
Despite the dynamic nature of the financial markets and the speed at which new information is provided to investors, cumulative abnormal return calculation continues to be an important tool for exploring market behaviour. Understanding CAR is beneficial to researchers, analysts, and investors, as it gives them insight into how information is processed in the market and the impact of major events.
Disclaimer: This essay should not be interpreted as financial, investing, or legal advice; rather, it is intended solely for educational and informational purposes. Calculations and examples are simplified for clarity. Your own research or the counsel of a knowledgeable financial expert should serve as the foundation for your investment decisions.
Every major market event tells a story—but understanding its real impact requires the right analysis. At Invest Daily Times, we transform complex financial topics such as cumulative abnormal return (CAR), market efficiency, and investment research into clear, actionable insights for investors and finance professionals alike. Explore more expert guides to strengthen your financial knowledge, and follow Invest Daily Times on Facebook, Instagram, and Twitter for the latest investing insights and market analysis.
















Leave a comment