


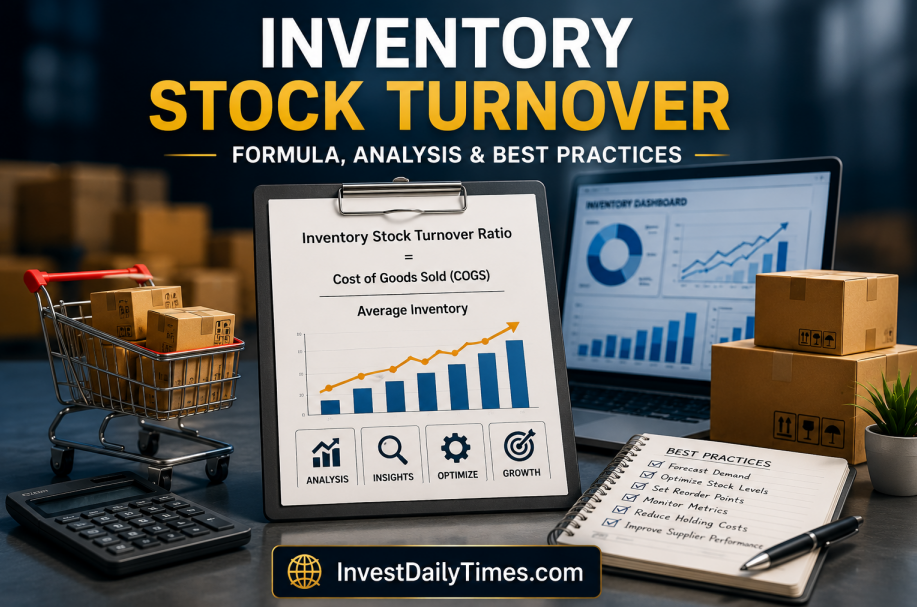
Today, we’ll talk about inventory stock turnover, a crucial indicator of how well companies handle their inventory. For product-based businesses, inventory is one of the most important assets. Its worth is determined by both the quantity held and the efficiency with which it passes thru the supply chain. In addition to increasing storage expenses and tying up working capital, excess inventory also increases the risk of damage, expiration, or obsolescence. Conversely, having a low inventory level may result in stockouts, lost sales, and unhappy customers. Striking the appropriate balance is key to the sustainable growth of the business. This ratio is one of the most useful measures for assessing inventory efficiency.
This financial and operational metric shows how many times a business sells and replenishes its inventory during a specific period, helping managers determine whether stock levels align with customer demand. Rather than focusing only on inventory value, the ratio highlights how efficiently products are converted into sales. Retail, manufacturing, wholesale, and e-commerce businesses use this analysis to improve purchasing decisions, optimize warehouse operations, strengthen cash flow, and reduce unnecessary carrying costs.
Nevertheless, the ratio should always be considered alongside industry performance, historical results, and other inventory metrics rather than evaluated in isolation. This guide explains how inventory stock turnover works, how to calculate it accurately, how to interpret the results, and which practical strategies businesses can use to improve inventory efficiency without compromising healthy stock levels.
What Is Inventory Stock Turnover?
Inventory stock turnover is a financial ratio which is used to measure the number of times that a business sells and replaces its inventory in a certain accounting period, that is, a month, quarter or fiscal year. The ratio is used to compare the Cost of Goods Sold (COGS) with the average inventory to measure efficiency in managing inventory. It is popularly applied to assess the efficiency of inventory management and to find out whether a company has the appropriate balance of product supply and customer needs. The computation is done to compare the Cost of Goods Sold (COGS) and the average value of inventory in the same period.
The application of the COGS rather than the total sales will give a more precise image since the inventory is valued at its cost rather than its selling price. Consequently, the ratio will depict the real movement of inventory rather than the revenue generated through mark-ups of the products. A higher turnover ratio generally means that products are moving faster and inventory is being replenished efficiently, holding costs are lower, and cash flow is increased.
On the other hand, a low turnover ratio might indicate a product that is not moving fast, or there is too much inventory, or the demand is not good enough and/or the purchase decisions made are higher than the sales demands. Businesses may want greater turnover rates, but there is no universal optimum. Retail grocery stores are usually characterised by a high turnover compared to the sales of high-priced or special products like furniture or automobiles. Thus, inventory stock turnover provides the most valuable insights, compared to businesses of the same industry and tracked over time.
Why Inventory Stock Turnover Matters for Business Performance
Inventory turnover is not just an accounting ratio; it is also an important indicator of operational efficiency, financial health and overall business performance. Since inventory represents capital tied up in products that have not yet been sold, understanding how quickly stock moves helps managers make better decisions about purchasing, production, pricing, and supply chain planning. For small businesses, effective stock management is also among the practical small business tips that can help control costs, improve cash flow, and maintain appropriate stock levels.
A healthy turnover ratio enhances the cash flow by converting inventory into sales faster, enabling businesses to invest the capital into new products, expansion, marketing, or operational enhancement. It also reduces warehousing costs, insurance costs, handling costs, and the likelihood of having outdated or obsolete products as a result of increasing inventory movement. Inventory turnover also aids businesses in detecting issues early enough before they become expensive. A decreasing ratio can indicate decreasing customer demand, excess stock, poor buying policies or fluctuating market dynamics.
On the other hand, a turnover ratio higher than normal may be a sign that the stock is low and the chances of stockouts and lost sales opportunities are high. Inventory stock turnover, when looked at in conjunction with historical performance and industry standards, offers good information that can be used in effective forecasting, optimisation of inventory and long-term profitability. Instead of a single metric, it is a significant element of a larger inventory management strategy that aims at a customer satisfaction/efficient resource usage balance.
The Inventory Lifecycle: From Purchasing to Product Sales
Each item in the inventory has a lifecycle which starts with the buying or production of products by a business and continues until the products have been sold to consumers. Understanding this process helps explain why inventory turnover is an important performance measure. The lifecycle begins with procurement, in which businesses buy raw materials or finished products according to anticipated demand. These products are then received, checked, and stocked in warehouses or distribution centres until customers place orders. Businesses can also refer to established stock accounting methods when developing processes for tracking and managing goods throughout this lifecycle.
The inventory accumulates carrying costs during this storage period, including warehouse expenses, capital tied up in inventory, insurance, taxes, utilities, handling costs, and the risk of damage, theft, or obsolescence. After the customer demand has taken place, inventory flows through the order processing, picking, packing, shipping, and the final delivery. Once the sale is made, the businesses refill the inventory based on buying plans and their expectations, and the cycle repeats.
Effective inventory control will ensure that there are no delays that create unjustified delays in this lifecycle. Any delay in the level of movement escalates storage expenses and chances of outdated inventory, whereas excessively aggressive inventory cuts may lead to shortages that undermine customer experience. Inventory stock turnover during this lifecycle can be tracked, which helps companies to have the right balance with the available products, efficiency in their operations and financial performance. Regarding the product lifecycle, product stages include launch, growth, maturity, decline and eventual obsolescence of inventory, which can be of great importance to inventory turnover in the long run.
How to Calculate Inventory Stock Turnover Accurately
Calculating the turnover ratio requires two key financial figures: Cost of Goods Sold (COGS) and Average Inventory during the same accounting period. Average Inventory is computed by summing the Beginning Inventory and Ending Inventory and then dividing the sum by two. These values are usually derived in the income statement and balance sheet of a company. The initial step is the calculation of average inventory, which takes into consideration the change in inventory levels during the reporting period. The conventional computation is:
Average Inventory = (Beginning Inventory + Ending Inventory) ÷ 2
After computing the average inventory, the Cost of Goods Sold/average inventory is then calculated to give the inventory stock turnover ratio.
Inventory Stock Turnover = Cost of Goods Sold (COGS) ÷ Average Inventory
The calculation of COGS rather than total sales yields a better measure in that inventory is only valued at cost and not its selling price. It is also important to match both figures with those of the same reporting period to get reliable results.
To track the trends in performance, businesses are advised to compute the inventory turnover at regular intervals, i.e. monthly, quarterly, or annually. Regular measurement enables managers to determine changes in demand, analyse buying decisions, slow-moving stock, and compare the outcomes with previous performance or industry standards, and to carry out more meaningful analysis.
Inventory Stock Turnover Formula Explained With Practical Examples
The inventory turnover formula is a widely used measure of inventory efficiency because it shows how many times a business sells and replaces its average stock during a specific period. Although the calculation is straightforward, interpreting the result correctly is equally important.
Formula
Inventory Stock Turnover = Cost of Goods Sold (COGS) ÷ Average Inventory
Average Inventory = (Beginning Inventory + Ending Inventory) ÷ 2
As an illustration, suppose that a business records annual Cost of Goods Sold of 500,000. It starts with an inventory of 80,000 and ends with an inventory of 100,000.
Average Inventory:
($80,000 + $100,000) ÷ 2 = $90,000
Inventory Stock Turnover:
$500,000 ÷ $90,000 = 5.56
This performance implies that the firm sold and changed its average stock about 5.56 times in a year.
By itself, this number does not indicate whether performance is good or poor. The ratio is to be measured with past business performance, industry standards, product lines, and seasonal demand trends. The systematic inventory turnover of a given inventory over time offers a much better image of the efficiency of inventory than a report based on a one-time reporting period.
How to Interpret Inventory Stock Turnover Results
Calculating the ratio is only the first step; understanding what it reveals is where its real value lies. The metric shows how effectively a business moves its inventory through sales, although the result should always be considered in the context of the industry, product type, historical performance, and inventory strategy. An increase in the ratio generally indicates faster inventory movement, stronger sales, and more efficient inventory management.
Nevertheless, a high ratio can be a sign of inadequate inventory quantities leading to high stockout risks as well. This is usually an indication of good customer demand, good buying decisions, and reduced carrying costs. Nevertheless, a very high ratio is not necessarily the best. It can indicate that there is a low level of inventory on stock, which can lead to stockouts, slow order fulfilment, and loss of revenue should there be a sudden surge in customer demand. A smaller turnover ratio would typically mean that there will be longer inventory in storage. This may be due to poor sales, overbuying, poor demand forecasting, or loss of appeal of products in the market.
The slow-moving inventory is tying up the working capital, increasing the cost of warehousing and increasing the chances of the inventory becoming outdated or unmarketable. Instead of evaluating the ratio independently, businesses ought to follow the trends of turnover over a period and compare the findings with those of respective businesses in the same line of business. This method will better determine the performance of inventory and identify areas where improvement can be made.
Key Factors That Influence Inventory Turnover
A mix of operational, financial, and market-related factors influences inventory turnover. With knowledge of such influences, businesses can better plan inventories without compromising on availability of products and efficiency of operations. Inventory turnover is greatly influenced by customer demand. Products with steady demand normally turn over in inventory faster, and products with falling demand tend to have surplus stock.
Proper demand forecasting assists companies in buying inventory that is more or less accurate to the projected sales, that help in reducing shortages and overstocking. The lead times of suppliers are also significant. Good suppliers who have a short lead time enable companies to keep lean inventories without risking stockouts. The increased safety stock often caused by longer or uncertain lead times may decrease turnover ratios. Turnover in retail, fashion and consumer goods can be influenced very much by seasonality.
The turnover tends to be high during the times of peak sales, whereas the slower seasons may temporarily decrease the ratio. Companies ought to consider the seasonal patterns and not just annual averages. Others are the pricing strategy, promotional activities, product life cycles, inventory replacement policies, and the general economic situation. Periodic examination of these variables will assist the companies to make well-informed purchase decisions and react better to dynamic market environments.
Financial Benefits of Maintaining a Healthy Inventory Turnover
A healthy turnover rate offers several financial benefits that contribute directly to long-term business performance. Liquidity, lower operating expenses, and better utilisation of capital are benefits of efficient inventory movement. Among the greatest advantages is that the cash flow is better, as the companies can recover the investment they made in inventory faster and can invest the capital in buying new products, expanding their operations, marketing campaigns, or other developmental opportunities. Increased inventory turnover also lessens the working capital tied up in stock that is not moved to sales, as well as enhances overall financial flexibility and efficiency.
An equal balance ratio in turnover reduces inventory holding expenses such as warehouse storage and insurance, utilities, security and handling costs of the products. A shorter time that products have been kept in storage reduces the chances of having obsolete, damaged or unsellable inventory because of changing customer preferences. Normal inventory turnover helps in making good buying decisions as it helps a business to match the inventory to the real demand rather than keeping high inventories as a backup.
This will reduce wastage and ensure that there is adequate stock to meet the needs of customers. Though it is common in businesses to strive to improve turnover, they do not necessarily focus on the goal of getting the highest possible turnover ratio. Sustainable profitability is achieved by ensuring inventory levels remain at a level that meets customer demand and at the same time minimises the unnecessary investment of inventory and operation cost.
Common Inventory Mistakes That Reduce Stock Efficiency
Avoidable errors are some of the things that lead to many inventory management challenges that reduce stock efficiency and hike operating costs. Early detection of these problems assists businesses in enhancing inventory performance and also achieving sound turnover ratios. Overstocking is one of the pitfalls. Buying larger quantities of inventory than customer demand ties up valuable capital, creates more storage costs and creates the risk of obsolete inventory. On the other hand, understocking leads to regular stockouts, which negatively affect customer satisfaction and loss of potential sales. Another significant cause of inefficient inventory management is poor demand forecasting.
Companies that use old sales data or assumptions in place of current demand trends frequently cannot maintain the right level of inventory. On the same note, disregarding seasonal changes may cause unwarranted stockpiling at low times of the year. A lot of organisations do not track slow-moving inventory frequently as well. Unmoving products still hold space in the warehouse, yet do not bring in much or any income.
These products grow harder to sell unless a regular inventory review is conducted. Other errors entail poor inventory records, slow replenishment decision-making, poor supplier coordination, and inability to compare inventory turnover with historical trends. Developing a disciplined inventory management process assists companies in minimising such risks and enhancing operational effectiveness and profitability.
Inventory Stock Turnover Improvement Strategies That Deliver Results
Improving inventory stock turnover cannot be achieved through a single solution; it requires a combination of effective planning, disciplined purchasing, and continuous performance monitoring. Companies that regularly review inventory performance are better positioned to reduce costs while maintaining strong customer service. Demand forecasting should be a top priority. Analyzing historical sales, market trends, and seasonal demand patterns helps businesses purchase inventory that more closely matches actual customer needs.
The improved forecasting decreases stock holding and minimises chances of stocking out. Periodic review of inventory is also very important. Slow-moving products will help businesses to launch specific promotions, discounts, product bundles, or even discontinue plans before stock becomes stagnant. Keeping proper records of inventory also aids in making good buying choices and efficiency.
Turnover can also be enhanced by enhancing supplier relations. Suppliers who are reliable and have a shorter lead time enable businesses to stock up on inventory more often with less inventory. A lot of organisations also implement inventory management systems that automate inventory monitoring, reorder points, and monitoring performance. Finally, inventory optimisation requires an effective balance between product availability, customer demand, and effective inventory investment. Companies that constantly improve their inventory policies have better chances of enhancing their profitability besides cutting down on costs of unnecessary operations. while
Inventory Metrics You Should Track Alongside Turnover
Inventory turnover provides valuable information about stock efficiency, but it should not be evaluated independently. Integrating turnover with other inventory measures can provide businesses with a better overview of operational performance and help make better decisions.
Days Sales of Inventory (DSI) is one of the most beneficial complementary measures, as it quantifies how many days on average a business can sell its inventory. A detailed explanation of the DSI metric can help businesses understand how this measure relates to stock movement and operational efficiency.
DSI = (Average Inventory ÷ Cost of Goods Sold) × 365
A smaller DSI would typically convey a fast movement of inventory and effective control of stock, whereas a bigger DSI could be an indication of slow sales or surplus stock that needs to be addressed.
The other crucial metric is the Inventory-to-Sales Ratio, which compares the average inventory to the net sales.
Inventory-to-Sales Ratio = Average Inventory ÷ Net Sales
A lower ratio can be said to be an indicator of managing inventory efficiently and good sales performance as compared to a higher ratio, which can be a sign of having more inventory in relation to customer demand. Gross Margin Return on Inventory Investment (GMROI) is another metric that businesses can use to determine the amount of gross profit generated on each dollar invested in inventory.
GMROI = Gross Profit ÷ Average Inventory Cost
An increase in GMROI tends to show that inventory investments are yielding higher returns and making a greater contribution towards profitability. Other performance measures are the frequency of stockouts, inventory carrying costs, rate of order fulfilment, supplier lead times, and inventory accuracy.
A combination of these metrics assists businesses in identifying areas of weakness in their operations, better demand prediction, optimal purchasing decisions and healthier inventory levels in the long run.
Industry Benchmarks: What Is a Good Inventory Turnover Ratio?
No single turnover ratio fits every business. A suitable turnover rate is relative to a number of factors, such as industry, type of product, pricing strategy, customer demand, as well as the supply chain structure. This is the reason why businesses need to benchmark their performance with similar companies as opposed to businesses in different sectors. Although there is no standardised ideal inventory turnover ratio, a ratio of between 4 and 10 is usually favoured by many businesses.
Nevertheless, this value depends greatly on the industry, the nature of the product, the demand, and the supply chain nature. Companies are not supposed to use a predefined standard to assess their performance but to compare it with the performance of their industry counterparts. A grocery retailer and stores that vend fast-moving consumer goods tend to have a significantly higher turnover since the product is sold rapidly and needs to be replenished frequently.
Businesses should strive to improve consistently, but also not to maximise the ratio but to attain the highest possible so that their inventory is sufficient to meet the demand of their customers. The comparison of the current outcomes with the past reporting can indicate some interesting trends in inventory performance and assist managers to find a possibility to enhance the purchasing, forecasting and inventory planning.
Best Practices for Long-Term Inventory Optimisation
Inventory optimisation is a long-term process that needs to be continuously improved, not periodically. Companies that constantly track inventory performance are in a better position to minimise expenses, enhance customer satisfaction and boost profitability. The basis of all inventory strategies should be accurate demand forecasting. Looking at the historical sales records, seasonal purchases, and market trends regularly would enable businesses to buy inventory precisely matching the projected demand.
Proofing of correct inventory records by conducting frequent stock counts also enhances better purchasing decisions and reduces expensive stock discrepancies. Based on the supplier lead time and the anticipated demand, businesses are supposed to set well-defined reorder points and safety stock levels. Close relations with suppliers help in more reliable deliveries and enable companies to have lean inventories without raising the risk of stockouts. Inventory optimisation is also a factor that is affected by technology.
The current inventory management systems offer real-time access to the stock levels, automatic replenishment notifications, and generate performance reports to be used in making informed decisions. Periodic analysis of slow-moving products, deleting outdated inventory and measuring inventory performance in reference to set goals would enable companies to keep their inventory activities efficient and in touch with the market dynamics. A good inventory performance is also enhanced by many businesses through the use of First-In, First-Out (FIFO) inventory rotation, ABC analysis of prioritising high-value inventory, setting the correct reorder point, maintaining the right safety stock, and regularly counting inventory cycles to increase inventory accuracy.
FAQs
What is inventory stock turnover?
Inventory turnover is a financial ratio that measures how many times a business sells and replaces its inventory during a given accounting period. It is determined by the division of Cost of Goods Sold (COGS) by the Average Inventory and is a very popular measure of the effectiveness of inventory management, inventory flow and general operation.
How do you calculate inventory stock turnover?
The formula is the standard one: Inventory Turnover Ratio = Cost of Goods Sold (COGS) ÷ Average Inventory. Average Inventory is calculated as: (Beginning Inventory + Ending Inventory) ÷ 2.
Is it necessarily good to increase inventory turnover?
Not necessarily. Although a high turnover is a sign of efficient inventory management and high sales, a high ratio can also indicate there is an excess inventory, which may lead to stockouts and sales opportunities are missed.
Why does the inventory turnover ratio get low?
The causes of low turnover are low customer demand, overstocking, poor demand forecasting, decreasing product popularity or ineffective buying decisions. Inventory analysis on a regular basis would highlight these issues before they can impact profitability.
What is the frequency of measuring inventory turnover?
Most companies compute inventory turnover every month, quarter, and/or year. With frequent monitoring, it is easier to determine trends, review inventory strategy, and react promptly to the dynamic business environment.
Conclusion
Inventory turnover is one of the most useful performance indicators for evaluating how efficiently a business manages its investment in stock. The ratio can offer insights about the efficiency of inventory management, purchasing decisions, sales, inventory planning, and general operation effectiveness by determining the frequency of inventory sold and replaced. Calculation of inventory turnover is an easy task, but to interpret the results, one has to look beyond that.
The benchmarks set in the industry, previous performance, demand, reliability of the supplier and seasonality all play a role in deciding what constitutes healthy inventory performance. An assessment of turnover and other complementary measures like Days Sales of Inventory (DSI), Inventory to Sales Ratio and Gross Margin Return on Inventory Investment (GMROI) gives a better perspective on inventory health.
Companies that integrate proper demand forecasting, strict purchasing habits, frequent inventory audits, and data-focused decision-making are well placed to maximise inventory and at the same time achieve high customer satisfaction. Instead of focusing on the maximum possible turnover ratio, it should aim to implement a balanced inventory approach that would contribute to sustainable growth, effective resource management, enhanced cash flow, and profitability in the long term.
Disclosure: The article is not financial, accounting, or professional business advice and is only meant to be educational in nature. After analysing inventory measures, always use business-specific data and refer to a qualified professional to make either a financial- or operation-based decision.
Invest Daily Times is the place where we post highly researched, practical information about business, investing, personal finance, financial ratios, inventory management, and market trends to assist readers in making sound financial and operational choices. Read additional professional Invest Daily Times guides and remain connected with us via Facebook, Instagram, and Twitter to get practical knowledge, industry news, and reliable recommendations to enhance business performance, financial management, and long-term growth.















Leave a comment